How the score is built
Published in full, because a risk score you cannot inspect is worth very little. Every input is open federal data. No proprietary layers, no API keys, nothing you could not verify yourself.
The weighting
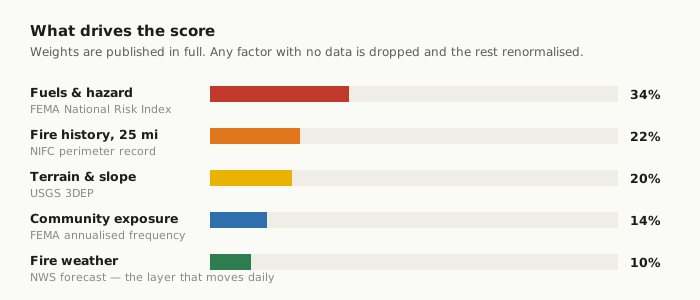
| Factor | Source | Weight |
|---|---|---|
| Fuels and hazard | USFS Wildfire Risk to Communities — Risk to Potential Structures | 34% |
| Fire history within 25 miles | NIFC fire perimeters, distance-banded | 22% |
| Terrain and slope | USGS 3DEP elevation, slope and aspect | 20% |
| Community exposure | FEMA National Risk Index, wildfire component | 14% |
| Fire weather | NWS / NDFD forecast fire-weather products | 10% |
Each factor is evaluated at the parcel point, normalised to 0–100, and combined by the weights above. Where a dataset returns no value for a point, that factor is dropped and the remaining weights are renormalised — nothing is silently assumed to be zero or average.
Why the fire weather component exists
Most wildfire risk scores are static. They blend hazard layers that change once a year or less, which means the number you see in February is the number you see in August. That is fine for underwriting and useless for deciding whether to run the chainsaw today.
The fire weather factor is the part that moves. It refreshes daily from the National Weather Service forecast, so a parcel sitting in a drying trend with wind in the forecast reads higher this week than the same parcel in a wet spring. It is deliberately a minority weight — weather changes the near-term picture, not the underlying hazard of the place.
The national danger dial
The dial on the homepage is a different thing from your address score, and it is worth being explicit about how it is set because a gauge that always reads Extreme is worthless.
It blends two live national counts: large wildfires over 100 acres that are less than 90% contained, weighted 65%, and active NWS Red Flag Warnings, weighted 35%. Each is scaled against a busy-season reference — 150 uncontained fires and 30 concurrent warnings — and the blend is banded into the same five levels.
Uncontained is the operative word. A 300,000-acre fire at 100% containment is a large number and a small problem. Counting total incidents, or counting whatever a paged query happens to return, produces a dial that is pinned to the top of the scale for months and tells you nothing.
Bands
| Score | Band | Typical insurance picture |
|---|---|---|
| 0–19 | Low | Standard admitted market, competitive pricing |
| 20–39 | Moderate | Standard market, basic mitigation keeps it there |
| 40–59 | High | Surcharges, inspections, stricter eligibility |
| 60–79 | Very High | Many admitted carriers decline; surplus lines territory |
| 80–100 | Extreme | FAIR Plan plus difference-in-conditions wrap is common |
What this score is not
- Not a prediction. It is a relative measure of how a location compares to others. A Low band does not mean a fire cannot reach you.
- Not your insurer's score. Carriers license proprietary models — Verisk FireLine, ZestyAI Z-FIRE, CoreLogic — and weight them differently. Ours is an independent reference point, not a replica.
- Not parcel-perfect. The underlying federal rasters have finite resolution. Two neighbouring homes can genuinely differ more than the data can see, particularly where one has cleared defensible space and the other has not.
- Not an emergency product. For active fire and evacuation decisions, follow your county emergency management office and official alerts.
Known limitations we would rather state than hide
Structure-level characteristics are not in the model. Roof class, vent type and the condition of Zone 0 are the strongest predictors of whether an individual house survives, and none of them appear in any national dataset. That is the single largest gap between this score and the reality at your address, and it cuts both ways: a hardened home in a Very High band is genuinely safer than the number suggests.
Fire history is recorded history. Areas with long fire-suppression records can read lower than their fuel load justifies.
The structure self-assessment
Separate from the score, and deliberately so. The six questions on a risk report cover Zone 0, vents, roof covering, deck, glazing and eaves, weighted 26, 20, 22, 12, 10 and 10 respectively. Those weights reflect what post-fire investigations repeatedly find about ignition mechanism, not a fitted statistical model.
Answers produce a vulnerability figure between 0 and 1, which shifts the location score by at most 18 points in either direction. The cap exists so self-reported input can never swamp measured data. "Don't know" is treated as moderately vulnerable rather than as the best case, because assuming the favourable answer is how a risk tool ends up flattering people.
The adjusted number is labelled self-reported and unverified everywhere it appears. No insurer will accept it. Its purpose is to show how much of your exposure is the building rather than the ground — which is the single largest thing every wildfire score in this category, ours included, cannot measure.
Corrections
If you believe the score at your address is wrong — particularly if the terrain or fuels data does not match the ground — tell us and we will re-run the point and publish what we find.