About our data
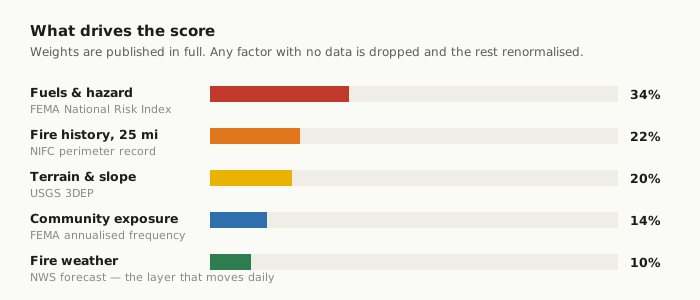
Eight public datasets, no proprietary layers, no paid feeds. This page covers what each one actually measures, how often it refreshes, and where it falls down. The methodology page covers how they are weighted.
FEMA National Risk Index
What it is. A national dataset estimating expected annual loss from eighteen hazards,
including wildfire, at county and census-tract level. We use the wildfire risk score
(WFIR_RISKS) and the annualised frequency (WFIR_AFREQ).
Updates. On FEMA release, roughly annually. We refresh our state aggregates monthly.
Limits. Census tracts are large and heterogeneous, so a single value covers ground that varies considerably. The score blends hazard with exposure — the building value at risk — so a tract with high hazard and almost no structures can score lower than intuition suggests. Tracts with no wildfire exposure return "No Rating" rather than zero, and we treat that as no data rather than as a zero.
NIFC WFIGS — current incidents
What it is. The interagency feed of active wildfire incidents, with location, acreage, containment percentage and cause. It is the same source that feeds most public fire maps.
Updates. Continuously, but each individual record only when the managing agency submits an update — often a few times a day, sometimes less during initial attack.
Limits. Point locations, not perimeters, so the marker shows where an incident is registered rather than the shape of what is burning. A fire's real edge can be well ahead of the last reported acreage. Small incidents below reporting thresholds may not appear at all. Containment means the share of perimeter secured by a control line, not the share extinguished.
NIFC interagency fire perimeter history
What it is. Mapped perimeters of past fires. We count recorded burns within 25 miles of an address since 2000, and separately count those over 1,000 acres.
Updates. Periodically as agencies submit final perimeters, with a lag of months after a season closes.
Limits. This is recorded history, not fire history. Long suppression records can make an area look quiet while fuel accumulates, which is precisely the condition that produces large fires later. It also includes prescribed burns, which is why we log-scale the counts and gate them against the hazard layer — without that, the Everglades read as high risk on burns that threaten no structures.
USGS 3DEP elevation
What it is. The national elevation dataset. We sample five points around an address at roughly 90 metres and derive slope from the gradient.
Updates. Rarely — terrain does not move.
Limits. A five-point sample captures the slope of the hillside, not a cut bank or a retaining wall beside the house. Aspect matters too and we do not currently weight it, though south and west-facing slopes carry more risk at the same gradient.
NOAA / National Weather Service
What it is. Gridpoint forecasts for relative humidity, wind speed and temperature, plus the active alerts feed we use for Red Flag Warnings.
Updates. Hourly or better. This is the only part of the score that moves day to day.
Limits. Forecast grids are coarse relative to terrain-driven local wind, which is exactly the wind that drives fire behaviour in canyons. A Red Flag Warning covers a broad zone and says conditions favour rapid spread, not that a fire exists.
US Census Bureau geocoder
What it is. The service that turns a street address into coordinates.
Limits. Coverage is good but not complete — rural addresses, new construction and non-standard addressing can fail to match. Where it does, we fall back to the coordinates from the address-suggestion provider, which are less precise.
OpenStreetMap and CARTO
Address suggestions come from Photon, running on OpenStreetMap data. Map tiles come from CARTO. OSM house-number coverage in the United States is incomplete, so some addresses will not appear as suggestions even though the site can still score them if you type the full address.
What none of this includes
No national dataset records the things that most determine whether an individual house survives: roof class, vent type, siding material, window glazing, deck construction, and the state of the first five feet around the structure. That is the largest single gap between any score on this site and the reality at your address, and it cuts both ways — a hardened home in a high band is genuinely safer than its number suggests.
Corrections
If a value looks wrong at your address, particularly terrain or fire history, tell us. We re-run the point and publish what we find.